Build the right representation of your data
Not all data should be presented the same way! the business context of the data is an important factor to be taken into consideration.
A small change in how you represent the information to your users can either skyrocket productivity or squash it to the ground.
In Beezr, Dataviews is the first thing the user sees when they access a module. As of this version, we support 4 modes of presentation:
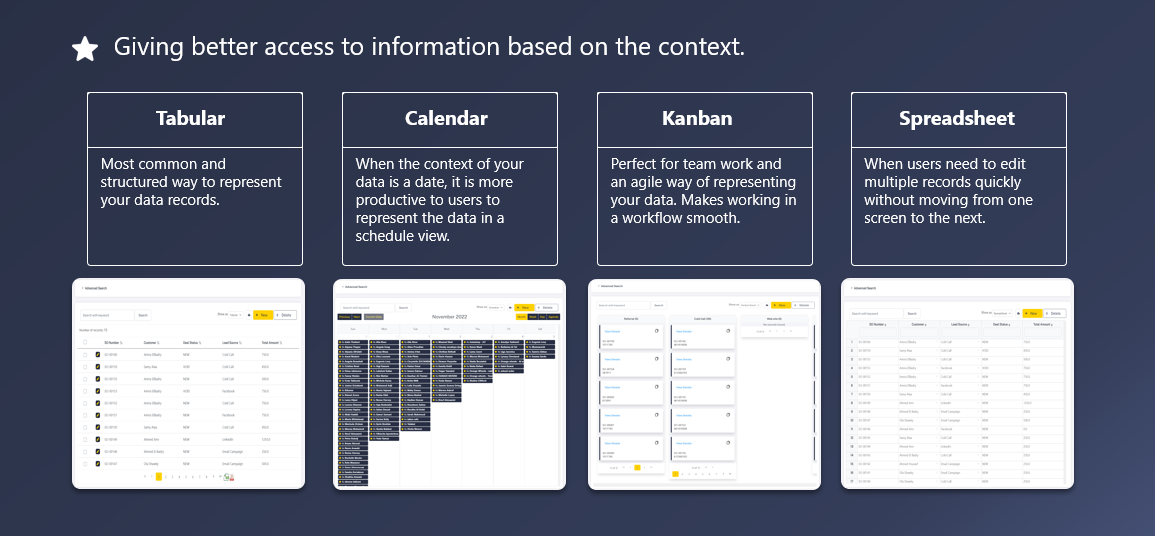
Each version is completely customizable and you can enable more than one view for the module so the user can switch between them.
1. Tabular View
Tabular views are the most commonly used views as they provide a clear and structured representation of the data for all users. Here are the steps to start configuring this view:
Step-1: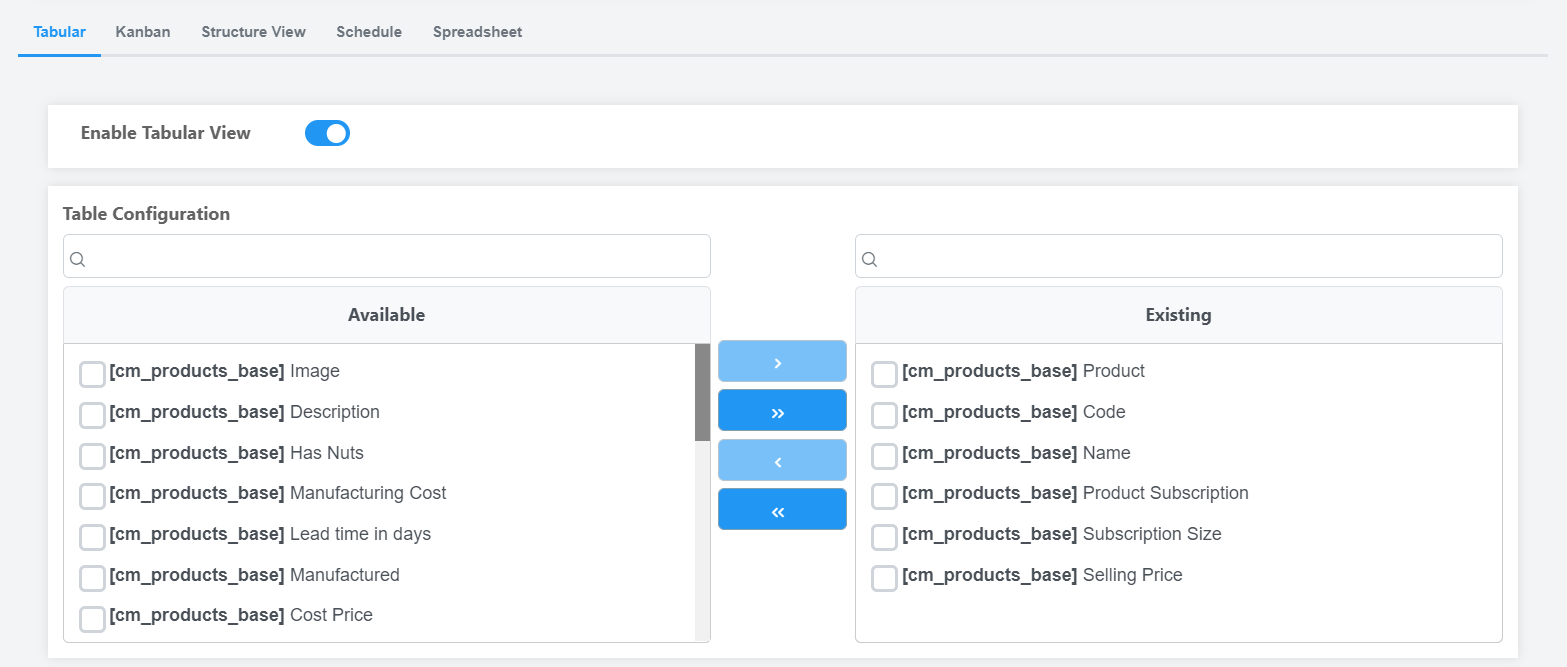
Step-2: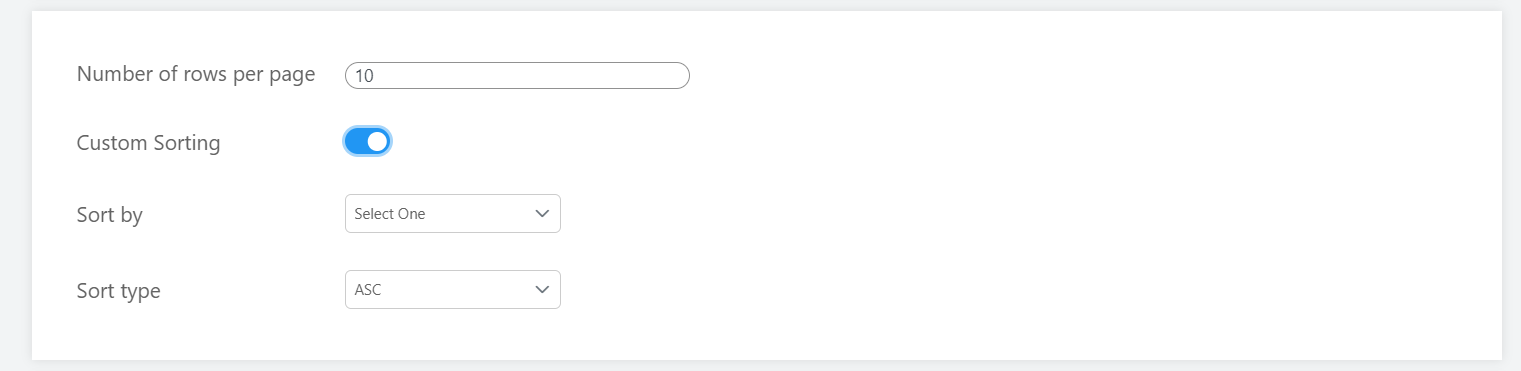
Step-3: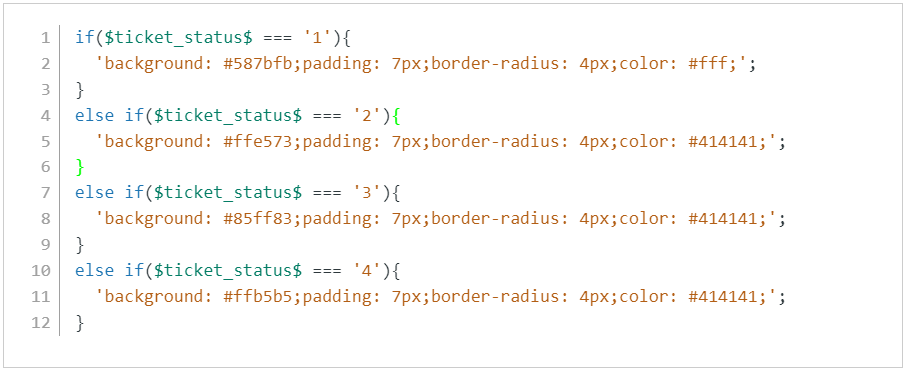
Step-2: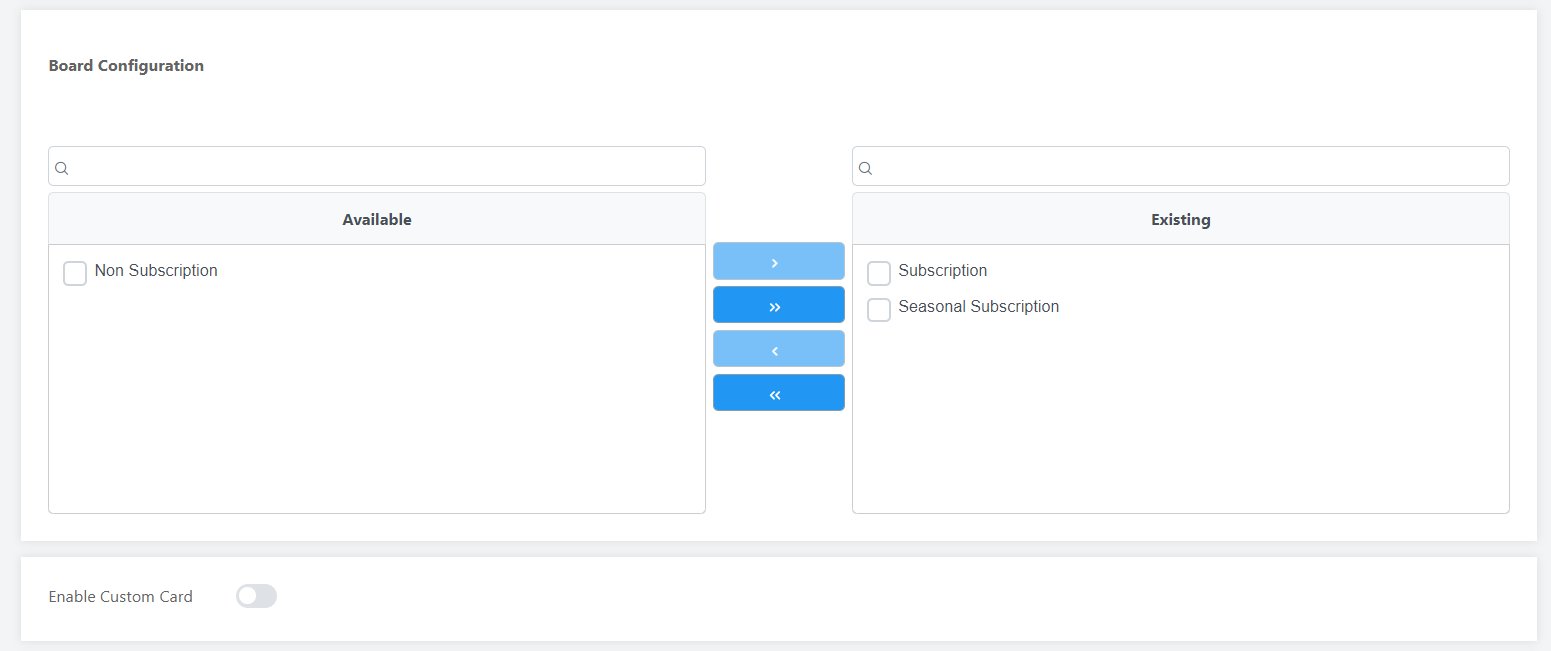
Step-3: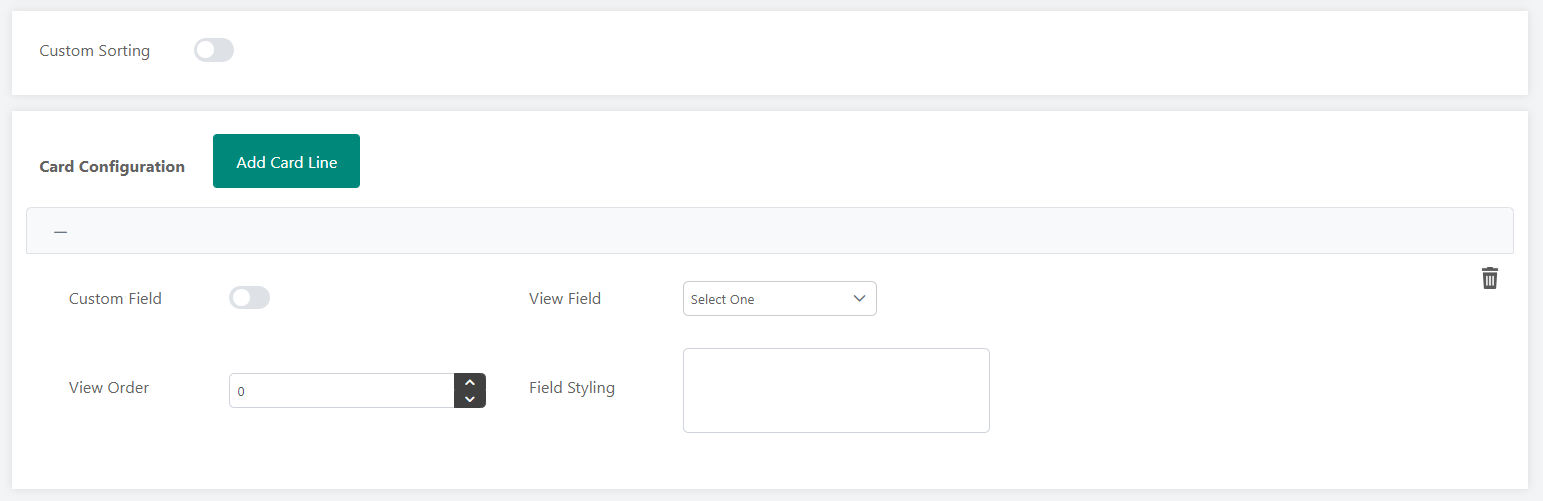
3. Schedule View
Schedule views are helpful when you want to view the data in a calendar view. This is mainly used when your records have due dates or start and end dates.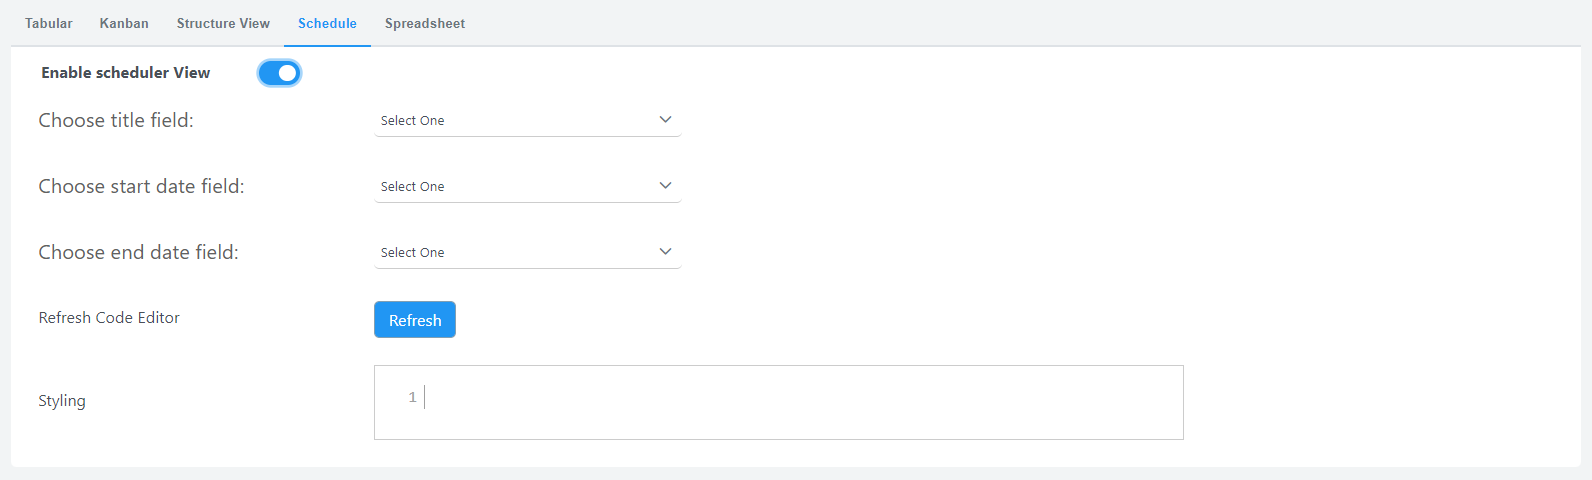
4. Spreadsheet View
Spreadsheets represent the data in editable cells. This is helpful when the users need to continuously edit multiple fields and rows at a quick pace.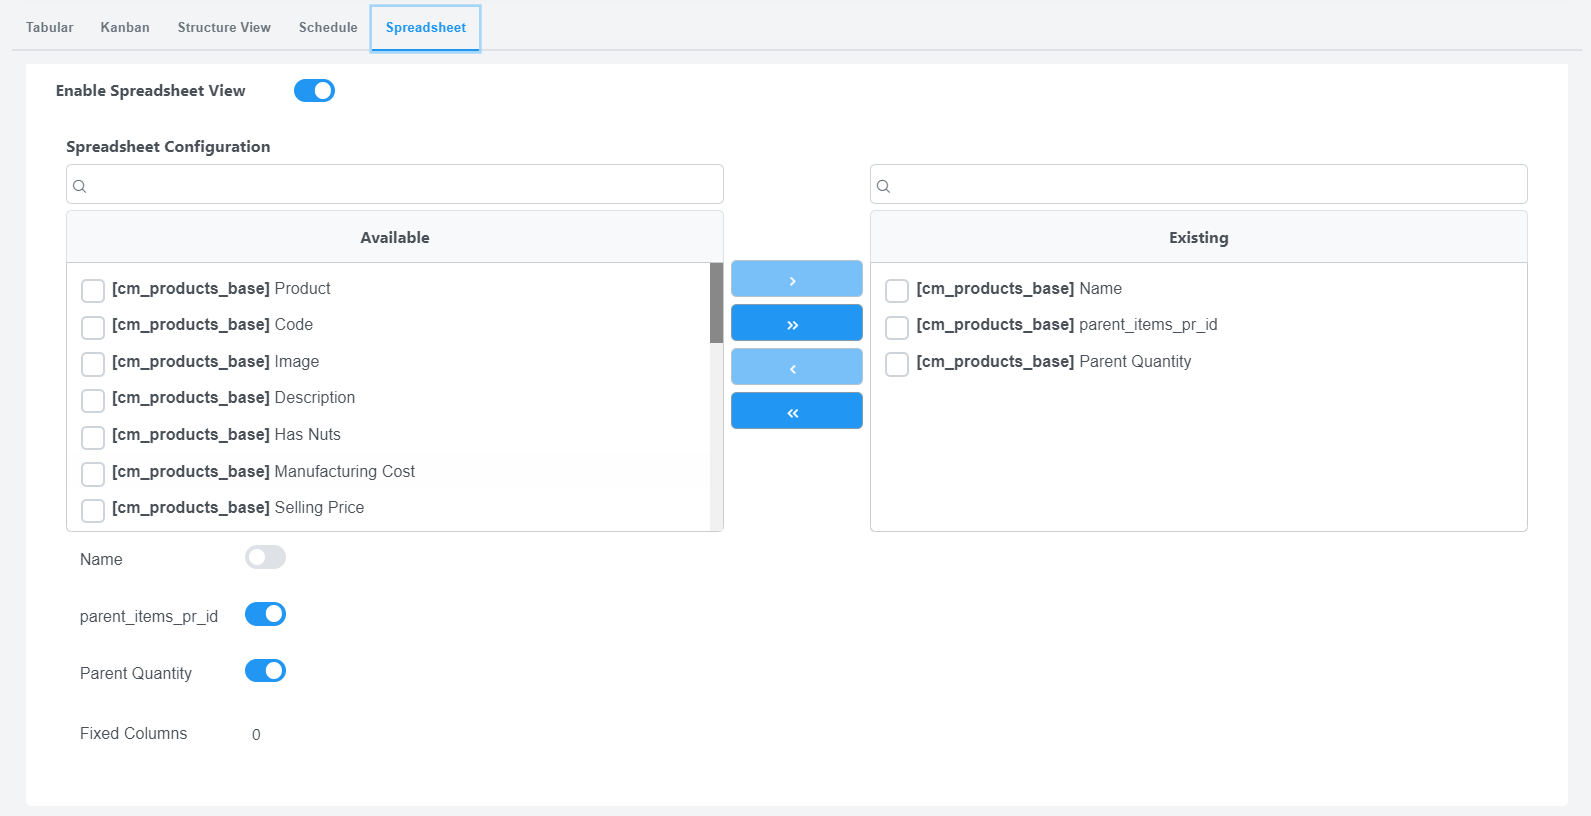
Not all data should be presented the same way! the business context of the data is an important factor to be taken into consideration.
A small change in how you represent the information to your users can either skyrocket productivity or squash it to the ground.
In Beezr, Dataviews is the first thing the user sees when they access a module. As of this version, we support 4 modes of presentation:
Each version is completely customizable and you can enable more than one view for the module so the user can switch between them.
1. Tabular View
Tabular views are the most commonly used views as they provide a clear and structured representation of the data for all users. Here are the steps to start configuring this view:
Step-1:
- Once you enable the Tabular view, the table configuration pick list will be made available.
- The list on the left-hand side represents all the available fields, whether from the selected module or related modules.
- Drag and reorder the fields to the right-hand side to configure how your table should look like.
Step-2:
- Customize the number of rows you want to view per page. It’s important to note that the higher the number the higher the effect it can have on the load time of the page.
- The default sorting mechanism for Beezr is on the creation date of each record. You can change this by adding a new default sorting mechanism for your table.
Step-3:
- For each column you add to the view, you will be able to add dynamic styling for it.
- For example, you want to highlight values in red if it is of certain status while in green if it is another. You can use Beezl to write your logic and return the required styling CSS.
- The return CSS should be between single quotes.
- Here is an example:
Once you've configured your view, click "Save".
2. Kanban View
Kanban views are useful when users need to quickly move records from one status to another. Records are represented in the form of cards and can be dragged and dropped between different status boards.
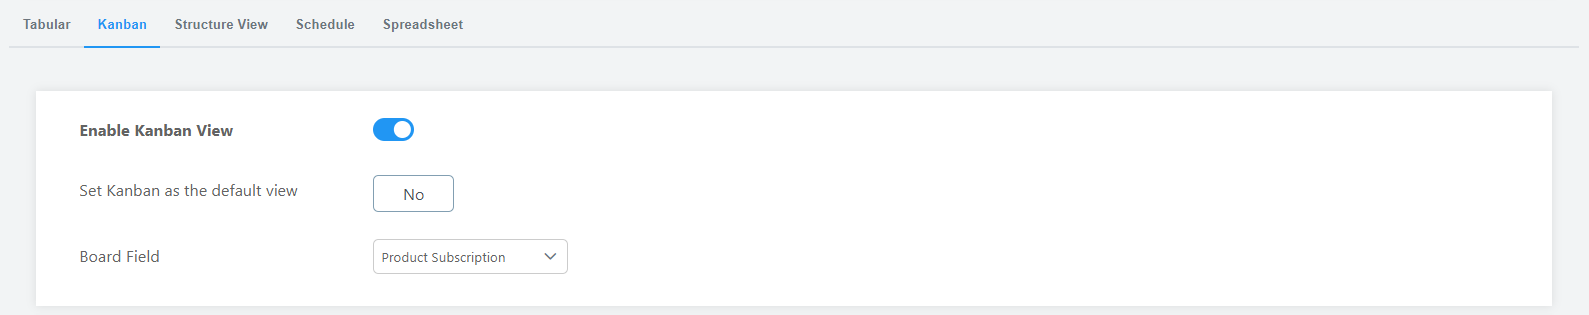
Step-1:
2. Kanban View
Kanban views are useful when users need to quickly move records from one status to another. Records are represented in the form of cards and can be dragged and dropped between different status boards.
Step-1:
- The board field can only be a lookup field in the module. Based on the values of the lookup the boards will be created.
- You can choose that the default view would be the Kanban board, the default view is the tabular view in the case that you have multiple views enabled.
Step-2:
- Choose the values from the lookup (board field) that you want to include in the view as boards.
- You can enable custom sorting for the cards as well. The default is the creation date.
Step-3:
- The final step is to configure how the card should look like. You have 2 options; either choose a field to view or a custom field that you compute using a Beezl script.
- You can also create custom cards that are HTML based.
- Control the field styling and order.
3. Schedule View
Schedule views are helpful when you want to view the data in a calendar view. This is mainly used when your records have due dates or start and end dates.
- The title field allows you to choose the information/subject of the event on the calendar.
- If you don’t have start/end dates and would like to use a single date field like a due date; choose the same date field for both configurations.
- Styling uses Beezl to compute logic to change the color of the event; for example, check if the current date passed the due date or not.
4. Spreadsheet View
Spreadsheets represent the data in editable cells. This is helpful when the users need to continuously edit multiple fields and rows at a quick pace.
- Drag the fields that you want to include in the view.
- With each field added to the (existing List), it will be added below the picklist. This configuration allows you to enable which cells should be editable and which are read-only. By default, all cells are read-only unless you enable them.
- You can also fix columns to adjust the horizontal scroll.